If you want to protect your organic search rankings in 2026, you must know how to measure Core Web Vitals using PageSpeed Insights (PSI) accurately.
Many SEOs and site owners simply plug their URL into Google’s free tool, stare at the massive “Performance Score” at the top, panic if it’s not green, and blindly install caching plugins hoping for a quick fix. This is a massive mistake that wastes development hours and rarely moves the needle for actual search engine rankings.
To truly optimize a website, you have to read PageSpeed Insights like a diagnostic surgeon. You need to understand which numbers impact the algorithm, which ones are just suggestions, and exactly how to isolate the elements slowing down your site.
In this exhaustive 2026 tutorial, we are going to break down the PageSpeed Insights interface piece by piece. We will explore the critical difference between field data and lab data, show you how to filter for specific metrics like LCP and INP, and translate complex waterfall charts into actionable SEO tasks. Let’s dive in.
Table of Contents
The 2026 Landscape of Site Speed Measurement
Google PageSpeed Insights is powered by two distinct engines. Understanding this is the single most important step in our PageSpeed Insights tutorial. If you don’t understand the difference between these two data sources, you will end up chasing your tail.
When you enter a URL, PSI generates a report split into two main sections:
- “Discover what your real users are experiencing” (Field Data)
- “Diagnose performance issues” (Lab Data)
Let’s dissect why this matters.
The CrUX Report vs Lighthouse (Field Data vs. Lab Data)
Field Data (The CrUX Report): This data comes from the Chrome User Experience Report. It is a 28-day rolling average of actual, real-world humans visiting your website using Google Chrome. It records their device speeds, their network conditions (5G, 4G, spotty Wi-Fi), and how they interacted with your page. This is the only data Google’s ranking algorithm cares about.
Lab Data (Lighthouse): Scroll down the PSI page, and you will see the “Performance Score” (that big circle with a number from 1 to 100). This is generated by Lighthouse, an automated tool simulating a single page load on a mid-tier Moto G Power smartphone over a throttled 4G connection. Google does not use this score for SEO. It is purely a debugging environment to help you find the causes of the poor real-world data above it.
Expert Insight: Never obsess over a 100/100 Lighthouse score. You can have a 65/100 Lighthouse score but still pass Core Web Vitals in the real world (Field Data) because your actual users have faster phones and internet connections than the Lighthouse simulation. Always optimize for the Field Data.
Step-by-Step: How to Measure Core Web Vitals Using PageSpeed Insights
Let’s walk through the actual process of running a test and extracting the data you need to fix failing Core Web Vitals.
Step 1: Running the Test (and Choosing the Right Toggle)
Navigate toPageSpeed Insights . Enter your specific URL, not just your homepage. If you want to rank a blog post, test the blog post URL.
Once the report generates, you will see two tabs in the top left: Mobile and Desktop.
Always start with Mobile. Google utilizes Mobile-First Indexing. Even if 80% of your B2B traffic comes from desktop devices, Google is crawling, rendering, and evaluating your site based on the mobile experience. When wondering about Google PageSpeed Insights mobile vs desktop, the mobile tab is your SEO ground truth.
Step 2: Evaluating the “Real User Experience” Section
Look at the top section labeled “Discover what your real users are experiencing.”
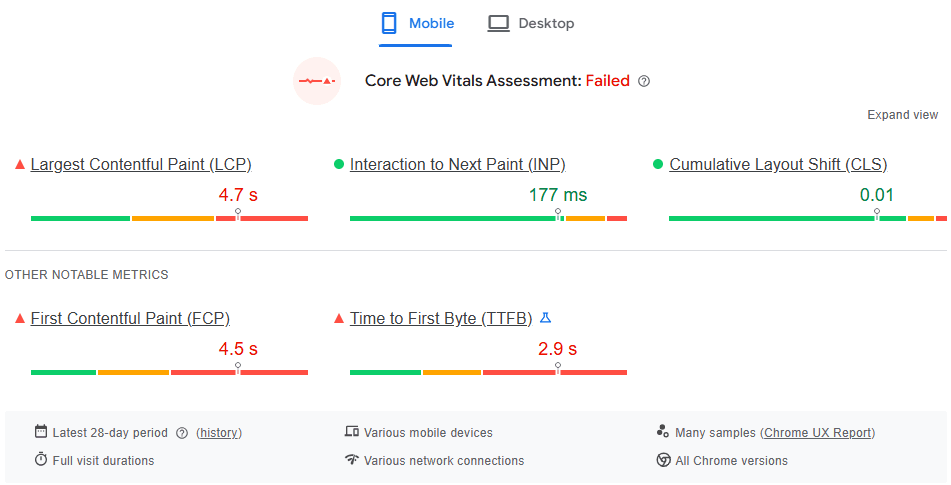
- The Assessment: In the top right of this box, it will explicitly say “Core Web Vitals Assessment: Passed” or “Failed.”
- The Toggle (This URL vs. Origin): By default, PSI shows data for the specific URL you entered. However, if your page doesn’t have enough traffic over the last 28 days to generate a CrUX report, the tool will automatically switch to “Origin” data. Origin data is the aggregate average of all pages on your entire domain. Always check which toggle is active so you know if you are looking at page-specific data or sitewide data.
Step 3: Expanding the Metrics View
Click the “Expand View” button on the right side of the Real User Experience box.
You will now see a detailed breakdown of the Big Three metrics:
- LCP (Largest Contentful Paint): Target is < 2.5s.
- INP (Interaction to Next Paint): Target is < 200ms.
- CLS (Cumulative Layout Shift): Target is < 0.1.
You will see a bar chart showing the percentage of your users who experienced “Good,” “Needs Improvement,” or “Poor” conditions. If 75% or more of your users fall into the “Good” category for all three metrics, you pass the assessment. If you are at 74% or lower on even one metric, you fail the whole assessment.
Diagnosing Issues with Lighthouse Data
Once you’ve confirmed what is failing in the real world, you must scroll down to the “Diagnose performance issues” section to figure out why.
Here is where developers and SEOs separate the amateurs from the pros. Do not just look at the overall score. You need to use the Metric Filters.
Right above the list of “Opportunities” and “Diagnostics,” you will see a filter bar: Show audits relevant to: All | FCP | LCP | TBT | CLS.
Isolating Largest Contentful Paint (LCP)
Click the LCP filter. Now, PSI will only show you the warnings directly hurting your largest element.
- Look for the “Largest Contentful Paint element” diagnostic. Click it. It will literally highlight the exact HTML node, image, or text block that is your LCP. If it’s an image, you now know exactly which image to optimize.
- Look at the “Opportunities” section. Does it say “Serve images in next-gen formats”? If so, convert that specific LCP image to AVIF or WebP.

- Does it say “Eliminate render-blocking resources”? This means CSS or JavaScript is downloading before your LCP image can even start. You will need to defer those scripts or use fetchpriority=”high” on your hero image.
Isolating Interaction to Next Paint (INP)
INP replaced First Input Delay (FID) and is strictly a measurement of main-thread blocking JavaScript. Because INP requires a human to click or type, Lighthouse (a bot) cannot measure INP directly. Instead, Lighthouse uses a proxy metric called Total Blocking Time (TBT).
Click the TBT filter. This will reveal what is causing your INP failures in the real world.
- Look for “Reduce JavaScript execution time.” Expand it. It will show you exactly which scripts (often third-party trackers like Facebook Pixel, Google Tag Manager, or chat widgets) are hogging the CPU.
- Look for “Avoid long main-thread tasks.” This is your roadmap for breaking up code or utilizing Web Workers (like Partytown) to offload scripts.
Isolating Cumulative Layout Shift (CLS)
Click the CLS filter.
- Look for the diagnostic explicitly named “Avoid large layout shifts.”
- Expand it. PSI will list the exact HTML elements that moved during the load, along with their “CLS contribution” score.
- Pro Tip: Look at the “View Original Trace” button (we will discuss this below). The most common CLS culprits are images missing width and height attributes, or web fonts causing a flash of unstyled text.
The Power Features of PSI
If you want to create a truly bulletproof SEO strategy, you have to dig deeper than the basic dropdowns. Here are the advanced PSI features most people ignore:
1. The Treemap (Visualizing JavaScript Bloat)
Near the Lighthouse score, click the button labeled View Treemap.
This opens a visual representation of all the JavaScript loaded on your page. The larger the box, the heavier the script. It instantly highlights “Unused Bytes” in red. If you see a massive red box for a plugin you barely use, you know exactly what to delete to improve your INP and TBT scores immediately.
2. View Original Trace (The Performance Tab)
Click the View Original Trace button. This opens the Chrome DevTools Performance panel right in your browser.
This provides a millisecond-by-millisecond screenshot timeline of your page loading. You can visually see exactly when the screen was blank, when the LCP rendered, and visually watch elements jump around (CLS). It is the ultimate visual proof to hand to a stubborn developer who claims the site “loads fast on their machine.”
3. Third-Party Summary
In the diagnostics section, find “Reduce the impact of third-party code.” This is a goldmine for SEOs auditing client sites. It aggregates all external requests (fonts, ads, analytics, social widgets) and shows exactly how many milliseconds they added to the main thread blocking time. If a client is failing INP, this table is usually the smoking gun.
Local SEO, Edge Caching and PageSpeed Insights
If you manage a local business or target specific geographical regions, you must understand a critical limitation of PageSpeed Insights.
When you run a Lighthouse test, Google runs the simulation from one of four servers located globally (usually the one closest to you, the person running the test, or a default US location). However, your Field Data (CrUX) is generated by local users in your city or state.
If your server is in New York, and your local business is in Los Angeles, your Lighthouse LCP might look okay because Google tested it from a US-East server. But your CrUX data will fail because real users in LA suffer from high latency.
The Fix: You cannot rely on lab data for Local SEO. You must use an Edge CDN (like Cloudflare) to cache your HTML at local data centers. Always trust the 28-day Field Data over the single Lighthouse test to know if your local edge caching is actually working.
Integrating PageSpeed Insights with Google Search Console
Testing URLs one by one in PSI is incredibly tedious for a 1,000-page website.
To measure at scale, you need to use Google Search Console (GSC).
- Open GSC and navigate to the Core Web Vitals tab under “Experience.”
- Click on the “Mobile” report.
- GSC groups URLs by similarity (e.g., all blog posts, or all product pages) and shows you the aggregate CrUX data for those templates.
- When you see a group failing (e.g., “LCP issue: longer than 2.5s (mobile)”), click on it.
- GSC will provide an “Example URL.” Take that specific URL and plug it into PageSpeed Insights to run the granular, step-by-step diagnostic process we outlined above.
This hybrid approach, using GSC to find the sick patients, and PSI to perform the surgery, is the ultimate technical SEO workflow.
FAQ: PageSpeed Insights and Core Web Vitals
Lighthouse (Lab Data) fluctuates based on current server response times, routing congestion, and the CPU load of Google’s testing servers at that exact moment. Minor fluctuations (1-5 points) are completely normal. Always rely on the 28-day Field Data for a stable metric.
Chasing a perfect 100 on mobile is often a waste of resources. It frequently requires stripping out essential marketing scripts (like analytics or CRM tools) that power your business. Aim for passing the real-world Core Web Vitals assessment (Green CrUX data), which usually correlates to a Lighthouse score in the high 70s or 80s.
PageSpeed Insights cannot access URLs behind authentication. You will need to use the Lighthouse tab built directly into your Chrome browser’s Developer Tools. Run an “unthrottled” test locally while logged in.
GTmetrix and Pingdom are excellent tools for waterfall analysis, but they use different scoring algorithms and testing locations. PageSpeed Insights is the only tool that directly shows you Google’s proprietary CrUX field data, which is what the search engine algorithm actually uses.
Conclusion: Stop Guessing, Start Measuring
Learning how to accurately measure Core Web Vitals using PageSpeed Insights is the most valuable technical SEO skill you can acquire in 2026.
By ignoring the vanity metric of the Lighthouse performance score and focusing strictly on the CrUX Field Data, you align your efforts exactly with Google’s ranking algorithms. By utilizing the specific metric filters (LCP, TBT, CLS), the Treemap, and the Trace view, you stop guessing at what is slowing your site down and start providing your development team with exact, actionable directives.
Don’t let poor page experience drag down your high-quality content. Master the tool, fix the bottlenecks, and secure the rankings you deserve.
Join the Discussion
When you check your most important page on PageSpeed Insights, what is your biggest bottleneck? Is your LCP in the red, or is third-party JavaScript destroying your INP? Drop a comment below with your biggest frustration, and let’s troubleshoot it together!